
2026-10-05
Litter Bin Capacity Planning: How to Size Public Waste Bins by Footfall and Collection Frequency
Right-sizing public litter bins: litter generation rates, footfall-based capacity math, collection frequency trade-offs and a capacity planning checklist for parks and streets.
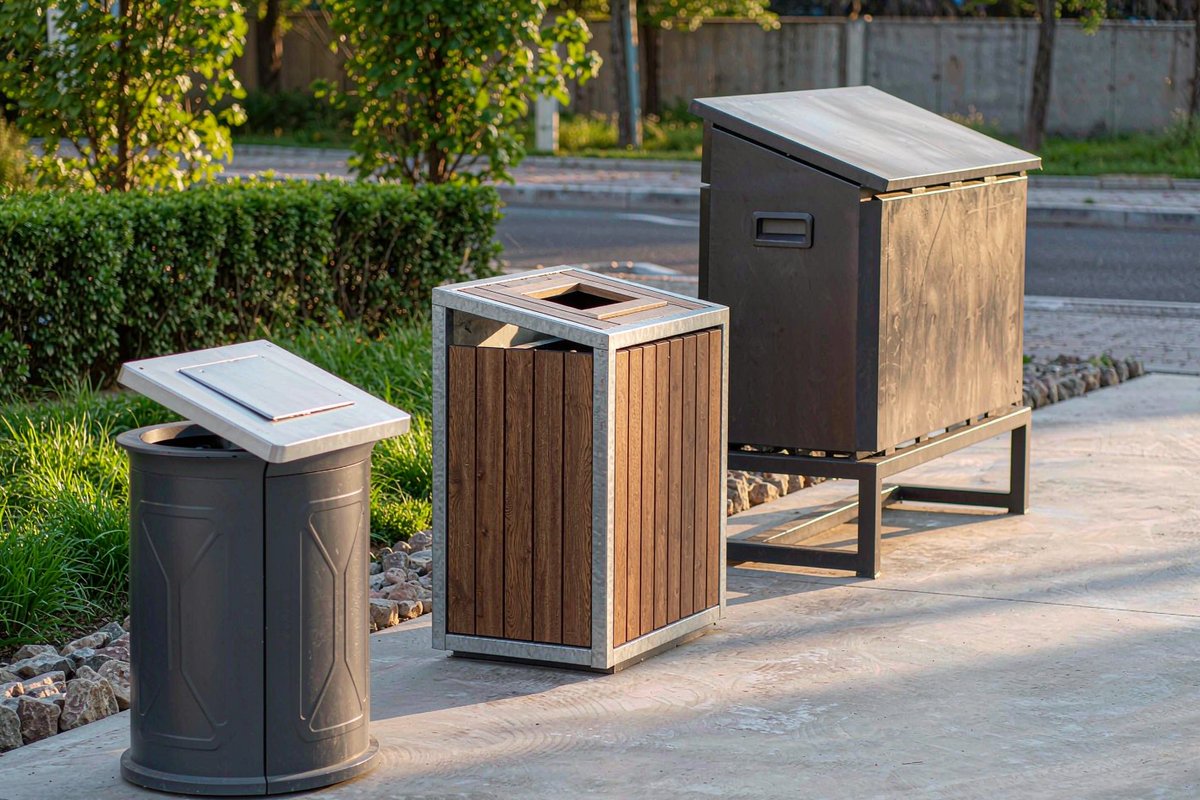
Every parks department knows both failure modes. The plaza bins overflow by 11 a.m. on a Saturday, and a crew is dispatched to rake scattered coffee cups off the paving. Meanwhile, two blocks away, a 100-litre bin on a quiet side street sits one-quarter full and gets emptied on the same schedule as the overflowing one — a truck roll for forty kilograms of air. Both failures come from the same root cause: litter bin capacity was never planned, it was copied from the last project. Capacity planning is the cheapest optimization in public waste management — it costs nothing at design stage and repays itself in collection labor for the life of the site. This guide sets out how to size litter bins from footfall, how capacity interacts with collection frequency, and where the common planning mistakes hide.
Why Capacity Planning Matters More Than Bin Style
Municipal studies consistently find that collection — not the bin itself — dominates the lifetime cost of public waste infrastructure. The container is purchased once; the crew that services it is paid every week for ten or fifteen years. Two bins with identical styling but different capacity planning behind them can differ by 30–50% in annual servicing cost. Getting capacity right delivers four benefits at once:
- Fewer overflows, which are the single largest driver of litter complaints and wind-blown street litter
- Fewer collection trips to low-yield bins, freeing crew hours for higher-value work
- Consistent site appearance, because a bin that never overflows reads as a well-managed space
- Right-sized capital spend, since oversizing every bin to "be safe" adds cost with no operational return
The Capacity Planning Formula
A workable planning method needs only three inputs: footfall, a litter generation rate, and the target interval between collections.
Weekly litter volume per bin position = daily footfall × generation rate × days between collections × container factor
The generation rate — the share of passing people who deposit litter — varies strongly by context:
| Site context | Typical generation rate | Notes |
|---|---|---|
| Transit stops and stations | 25–40% | Food and drink packaging dominates |
| Retail streets and food courts | 15–30% | Peak at meal times; peak-to-average ratio matters |
| Urban parks (weekends/events) | 8–15% | Seasonal and event-driven spikes |
| Urban parks (weekdays) | 3–8% | Baseline pedestrian litter |
| Office / campus grounds | 2–5% | Compensate with indoor bin strategy |
| Trails and low-traffic greenways | 1–3% | Often underserved deliberately |
Container factor converts footfall-based litter into bin fills: roughly 0.5–0.8 litres of loose litter per deposit event, compacting to about half that volume in a standard bin. With a 120-litre bin, plan on 150–200 deposit events per fill at realistic compaction.
Worked Example: A 10-Bin Park Layout
Take a linear park with 20,000 combined daily visits across ten bin positions, a 6% average generation rate, and collections every 2 days:
- Daily deposits site-wide: 20,000 × 6% = 1,200 events
- Per bin: 120 events/day × 2 days = 240 events between collections
- At 0.65 litres per event: ~156 litres of loose litter per bin — a 120-litre bin overflows; a 160-litre bin runs full
The planning response is not automatically "buy bigger bins." Any of these fixes the same problem, and the right one depends on the site:
- Redistribute positions toward the measured high-yield zones (entries, playgrounds, picnic lawns) instead of spreading bins evenly
- Increase collection frequency on event days only, with a documented trigger
- Upsize the 3–4 highest-yield bins to 160–240 L while keeping standard bins elsewhere — a hybrid layout, not a fleet-wide change
- Add recycling pairs at food zones, which removes 30–40% of deposit volume from the litter stream
Collection Frequency vs. Bin Size: The Core Trade-Off
| Strategy | Capital cost | Collection labor | Overflow risk | Best for |
|---|---|---|---|---|
| Many small bins, daily collection | Higher (more units) | Highest | Low | High-image civic spaces, transit frontages |
| Fewer large bins (160–240 L), every 2–3 days | Lower | Moderate | Moderate | Parks, campuses, residential streets |
| Hybrid: large bins at nodes, standard elsewhere | Moderate | Optimized | Low | Most real-world sites |
| Sensor-monitored, demand-based collection | Moderate + tech | Lowest | Low | Large fleets with variable footfall |
The hybrid strategy wins in most tenders because it matches capacity to measured demand instead of to a grid. Reserve fleet-wide upgrades for sites where footfall data shows genuine uniformity.
Common Capacity Planning Mistakes
- Even spacing instead of demand mapping. Bins distributed on a fixed grid put half the capacity where the litter isn't. Map deposits first, then position bins.
- Designing for the average day. Weekend and event peaks run 2–4× weekday volumes. A layout sized for Tuesday fails on Saturday; either plan peak capacity at known event zones or contract event-day servicing.
- Ignoring the "full at 80%" rule. A bin is operationally full at roughly 80% of geometric volume — users stop using a bin that looks full long before it is physically full. All planning numbers should apply this derating.
- Forgetting wind and waste type. Lightweight, high-volume litter (coffee cups, food packaging) needs covered or hooded openings and more litres per event than dense waste.
- No review loop. Footfall shifts, retail opens, routes change. Re-run the numbers annually with the collection crew's overflow logs — they are the best free dataset a municipality owns.
A Capacity Planning Checklist for Your Next Tender
- Map litter generation by zone before fixing bin positions; use footfall counts or crew observations
- Size against the peak day, not the average, at 80% operational fill
- Document the collection frequency assumed in the layout — capacity and frequency are one specification, not two
- Specify a capacity ladder (e.g. 80 L / 120 L / 160–240 L) rather than one bin size everywhere
- Include covered or hooded openings where wind-blown litter is documented
- Keep liner and lifting compatibility across sizes so one truck and crew type services the whole fleet
- Require structural durability — hot-dip galvanized steel, quality powder coating — because a correctly sized bin only saves money if it survives its service life
Source Right-Sized Bins from the Factory
AOTUDE manufactures outdoor litter bins, benches, planters and site facilities at its Foshan factory in China and supplies municipalities, landscape architects and contractors in 40+ countries factory-direct. Our litter bin range spans the full capacity ladder — from compact 60–80 L street bins to 160–240 L park and event containers — all built on hot-dip galvanized steel with UV-stable powder coating in specified RAL colors, with hooded, locking and recycling configurations available. With OEM/ODM customization from MOQ 50 pcs per SKU and a 5–10 year structural warranty, we support capacity-planned layouts of any mix without forcing fleets into a single SKU. Browse the range and request a factory-direct quotation at https://aotude.com.